
“Looking Back” on an Ongoing Crisis: Implications for Investors
Introduction
What the history books will say about 2026 is still to be determined. As our interview with Thomas Wright of Brookings noted, the absence of regime change in Iran has led to fewer good military outcomes for the US and new insights into how Iran can assert power in the region. Iran's neighbors, such as the UAE, are more concerned about Iran now, not less.
Investors would be wise not to focus solely on the opening of the Strait of Hormuz in viewing energy markets in the future. Nor will warfare be the same. Low cost drones and armaments have proven far more damaging to military and energy assets than anyone anticipated. Again, this shift has major implications for power dynamics between small and large actors, but even more so in how the US will need to shift its Asia/Pacific strategy as China focuses its resources on these offensive and defensive weapons.
Profits Drive Markets
But apart from these important medium-term issues, it is corporate profits that matter to markets. Equity markets, we believe, care more about the extent of any interruption to growth than securing the best long-term outcomes for the Middle East. In short, the terms and conditions of any truce are of little importance to corporate profits in the next six months.
While significant risks remain, several key patterns CIO Group identified at the start of the Iran conflict are playing out:
Spot month crude oil futures likely reached a “crisis price” on March 31 at $118. Brent crude has not advanced above this price level even as the duration of the energy shock extended.
More Energy Supply Cushions Markets
The “crisis price” is a level traders use to define the scope of the ongoing supply shock. It reflects speedy analyses of an unfolding commodity shortage. The initial jump in spot oil prices is typically an exaggeration. As we pointed out when Russia invaded Ukraine, the $128 peak price was never exceeded even as the war enters its fourth year.
Unlike 1974, the world in early 2026 was oversupplied with crude oil. The free passage of trade through the Persian Gulf is all that is required for energy costs to drop. Yet of all the patterns and analogies that have worked thus far, we are most concerned that our “crisis price” premise won’t prove correct. As we discuss below, the severity of the trade impasse risks rationing and demand destruction if the energy supply chain interruption persists. Furthermore, the possibility that more energy assets can be damaged militarily remains.
Shocks are Not Busts
Geopolitical shocks - particularly regional conflicts - have very rarely catalyzed fully-global economic downturns. US equities have tended to rebound to pre-shock levels in just a month’s time. In the present case, it has taken just six weeks for the S&P 500 to recover its late February, pre-shock level with 19 of 21 cases since WWII as the example.
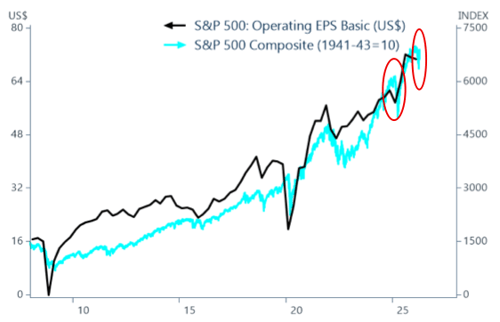
It’s likely, in our view, that first quarter large cap US EPS show gains of 16% from a year ago (see Figure 1). This means a 12-15% full year gain may be within reach even in an imperfect economy. If the energy shock does not persist and worsen, profit gains will persist into 2027. This supports solid US equity market gains this year despite the shocking developments in Iran.
International Shares to Shine Again if Energy Shock Passes
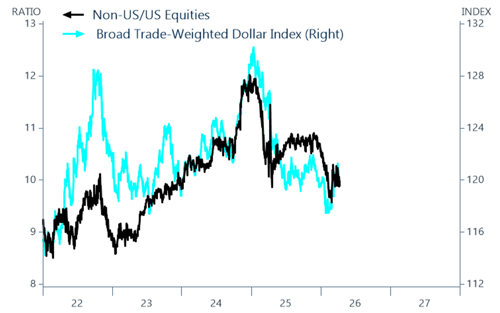
The energy shock is critical to the relative performance of non-US shares and other foreign currency assets. It is not certain yet if a reopening of trade through the Strait of Hormuz by some means allows energy supplies to rebound sharply. If so, energy importing economies of Asia and Europe - which have seen the greatest impacts so far - will have the greatest scope to recover. This should lead to their outperformance vs US equities.
An easing of energy costs would also clear a path for a resumption of modest Fed rate cuts, resuming the 2025 downward trend for the US dollar. This could boost all assets to some degree, but non-USD assets more (see figure 2). Conversely, the US may attract safe-haven flows if the energy shock persists given the US now has an energy trade surplus. In this scenario, overall global equity returns would be muted with the US outperforming.
Our Active Asset Allocation Methods are Working Well
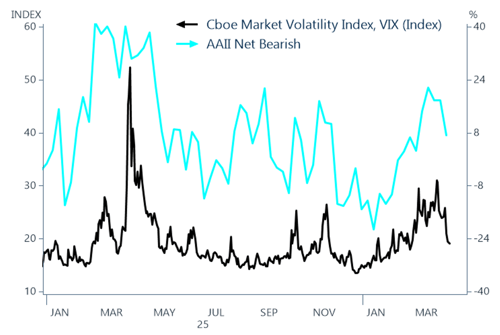
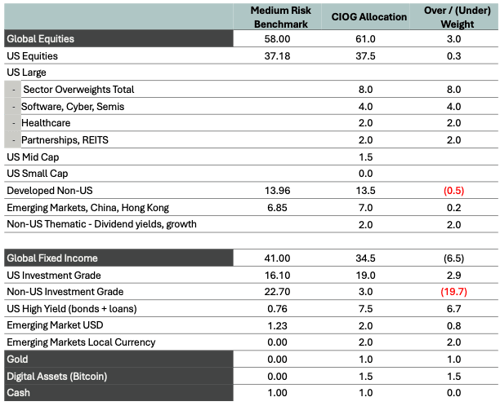
With the various potential paths and a modest dislocation in global markets, we’ve adhered to our active asset allocation principles and added slightly more to world equities in the past week (see figure 3). This included a slightly higher allocation to US equities, which in our view, may rise 7-10% further over the remainder of 2026 without heroic optimism. We included a slightly higher allocation to Japan, given its potential to outperform in several scenarios, and Europe, where we were underweight (please see AA Table Fig 4). It is not typical for us to add to country markets without respect for industry selection. However, industry sectors have been highly correlated during the Iran shock and our existing sector positions did not need revision in our view.
The “big picture” in our view is very much the same as the one we set out in our Outlook for 2026. Non-US equities have outperformed the US for 15 months as the US dollar has moderated. This followed a record 15 years of US outperformance. In that light, the latest energy shock is largely an interlude. Yet, US AI investment spending and commercialization is a potent driver of US returns that can’t be under-played even in the third year of a boom.
Risks to Markets Remain - The Most Critical Pipeline in the World
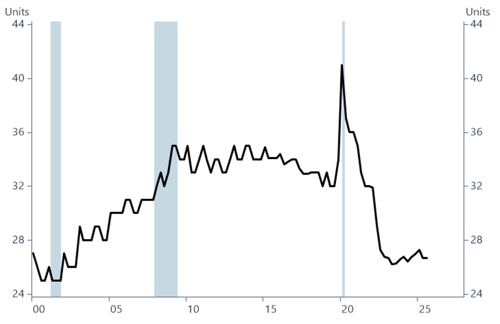
As discussed in points above, the true extent of the gulf energy shock is unfolding and the outcomes uncertain. OECD strategic reserves are low and could cover just a month’s crude oil consumption (see figure 5). As is typical at the end of winter, Europe has run down its supply of natural gas, leaving it vulnerable to shortages.
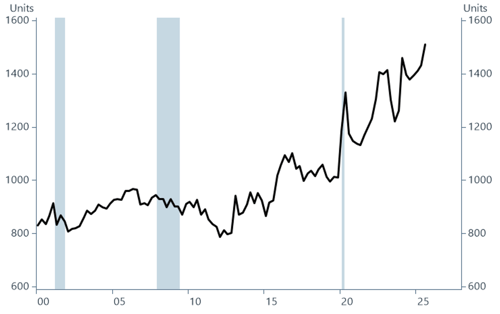
At the same time, commercial oil stocks globally were high when the shock hit (see figure 6). The US is contributing to supply with its strongest net energy exports in history. In China, EV sales have resumed a steep climb.
A New Saudi Pipeline
Perhaps most importantly, Saudi Arabia has successfully redirected its exports with a pipeline to the Red Sea. For the moment, this pipeline may be the most critical artery for the world economy. The roughly 5 million barrels of crude leaving Saudi Arabia this way is equal to 25% of the oil that normally traverses the Strait of Hormuz. Other adaptations are taking place.
Even with markets and pipeline adjustments, the longer markets live without the 10-15 million barrels (13% of global supply) of oil and 20% of LNG, global inventories fall and rationing looms. Keeping the Strait of Hormuz shut for good is not easily compatible with the bullish market recovery.
Stay tuned!