Don’t Miss the Real Story for Equities
“With AI, the barriers to analysis and production have collapsed. What is now scarce is judgment — the ability to select, edit, refine, and reject. The ability to distinguish between what is loud and what is lasting. To recognize the difference between what’s trending and what’s true.”
Last week, the CIO Group reallocated some of our semiconductor and tech hardware exposure – see last week’s edition. We shifted assets to non-tech dividend growers.
Building AI infrastructure will create immense new capacity for the world economy to grow. In fact, we are seeing signs that its impact on the broader economy is already underway. Profits in non-tech businesses around the world are beginning to rise more strongly.
Friday
A robust jobs number flipped the market's central assumption about rates. The bond market is once again fully pricing a rate hike by year-end. Treasury yields jumped, with the 10-year rising above 4.5% and the 30-year topping 5%. The S&P was down 2.6% and remains up roughly 7–8% on the year.
We’ve long highlighted both the unsustainable pace and immense strength of AI infrastructure spending. That’s what made Friday’s downstroke so notable. The Nasdaq was down 4.2% to close around 25,709, marking its worst session since April 2025.
The damage was concentrated in chips and cascaded across the rest of the Nasdaq 100. Broadcom fell more than 7%, following a 13% drop the day before. Marvell Technology and Micron plunged about 16% and 13% respectively. Intel and AMD each lost around 11%. Nvidia fell roughly 6%.
These were the stocks with the greatest upwards earnings revisions in 2026.
Positive Stirrings in the “Non-Tech Economy”
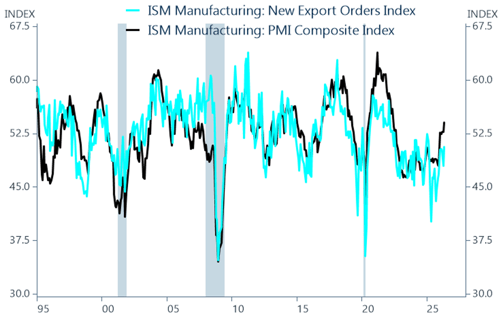
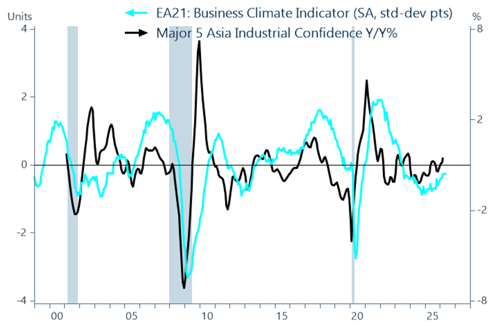
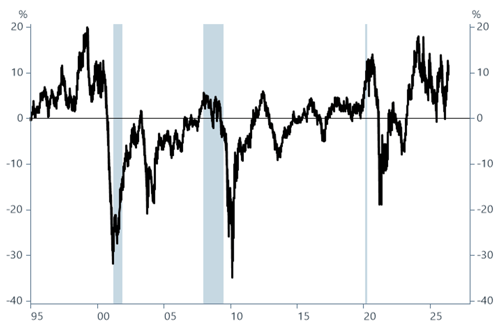
We see the strongest readings on US manufacturing sentiment in four years (Figure 1). And while readings are not as strong as the US survey, the fact that industrial sentiment readings in Europe and Asia have strengthened rather than faltered during the Iran shock is in stark contrast to expectations (Figure 2).
While the initial gains are nascent and manufacturing sentiment is highly influenced by trade flows, we believe that enduring growth for industries outside of US tech spending will matter for equity market leadership.
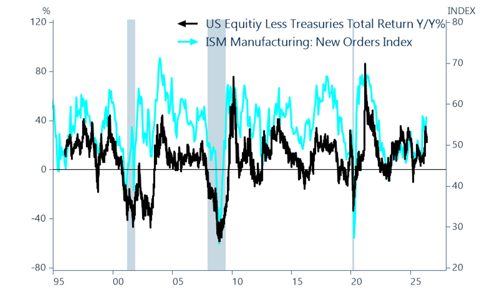
The market cap weighted S&P 500 has sharply outperformed the equal-weighted index, demonstrating the narrow breadth of tech-led appreciation. In contrast, the broadening gains in growth across industries in the PMI reports suggest stronger underpinnings for the equity market than just the money pouring into tech hardware (Figure 3).
This is Not the End of the Tech Stock Boom, But it is a Warning for Investors
Volatility is nothing unusual for semiconductors and the AI boom leaders.
Remember, the MAGS ETF (7 stocks) fell nearly 34% from their December 2024 highs amid tariff-driven macro shocks. Just over a year ago, a cocktail of aggressive US–China tariffs, rising inflation expectations and fears of a global slowdown triggered that sharp correction. Therefore, Friday's minus 4%-Nasdaq day is a rounding error by comparison.
Post the “tariff plunge”, MAGS fully retraced the drawdown within 60 trading days and rallied more than 77% to new highs.
After history’s largest rally, we still see ongoing growth and massive future maintenance spending on semiconductors and other tech hardware. But we believe the performance of semis is very unlikely to repeat (Figure 4). The firms that are driving that performance are now more cyclical and vulnerable to setbacks.
Future gains for tech shares are likely. As discussed last week, the sector represents “what the economy is becoming” and has roughly tripled the return of the broader market over the past four decades. Yet, the concentration risk in most client portfolios needs to be addressed wisely.
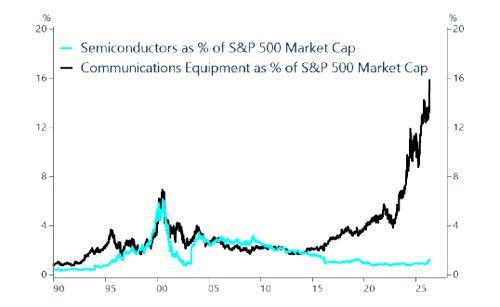
This concentration risk is globally significant for equities (Figure 5). Unlike 1999, non-US equities don’t share the sky-high valuations of US tech. Yet, investors have certainly concentrated both their US and non-US allocations in one sector. In Emerging Markets, the three largest firms accounting for nearly 30% of market cap are all semi-conductor related.
More Agony Ahead for Bonds?
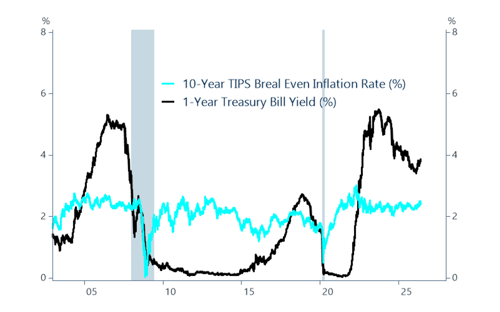
Despite the rhetorical bombast against the bond market of late (please see our Point of two weeks ago) the rise in inflation related to the Iran war has been priced as a very mild long-term issue (Figure 6). This is because it has been driven by a supply chain disruption – a logistics issue – not central bank money printing.
With this said, if the Straits of Hormuz remain closed, energy costs continue to rise, and growth remains resilient, that scenario would likely continue to drag on bond returns.
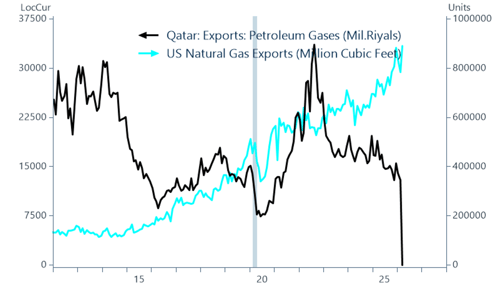
Prior to the conflict, our global measure of crude oil supplies reached a record. But in recent months, OPEC production has fallen by a record amount due to the inability to store and ship. A weaker-than-feared price spike has helped prevent greater economic damage.
We believe more “dark ships” have made their way through the Straits (transporting energy exports), than official reports state. In addition, Saudi Arabia’s East-to-West pipeline is transporting about 25% of pre-conflict Persian Gulf crude oil. Timing is also fortuitous. Gas and oil demand is seasonally weak in Springtime.
What Investors Need Most Now: Judgment
This week, investors are grappling with questions of tech valuations and the impact of the energy shock on inflation. But what they may not see is the likelihood that profits will be rising in non-tech businesses around the world.
In short, it is time to acknowledge the better-than-feared performance of the world economy, much of which doesn’t have AI spending driving it.
The last unresolved question we confront is the state of the war with Iran. President Trump used the term “boring” to describe negotiations. Yet the state of future energy supplies is still an unknown positive or negative catalyst for the markets and the economic outlook.