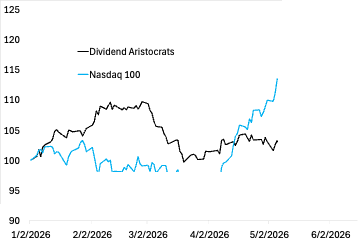
There’s Not Much Difference Between Panic and Euphoria
The Philadelphia Semiconductor Index (SOX) dropped 12% in the seven days through June 10. And, as usual, our LinkedIn mailbox was hit with typical questions: Is this “the end”? The beginning of a US recession? Many called the SpaceX offering “the end” of sanity for markets. And so on.
For investors and speculators who have been glued to their brokerage accounts every day, seeing gains of 40% or more, “losing” 12% seemed “huge”.
For CIO group, these past two weeks should serve as a reminder of why investors should carefully discern the fundamental outlook for the economy and avoid both “panic” and “euphoria”.
As we wrote two weeks ago, the most cyclical and volatile tech hardware-maker shares returned as much as 250% in the first half of this year. This prompted CIO Group to reduce our overweight allocations to semis in the US and Asia for the first time.
The Facts
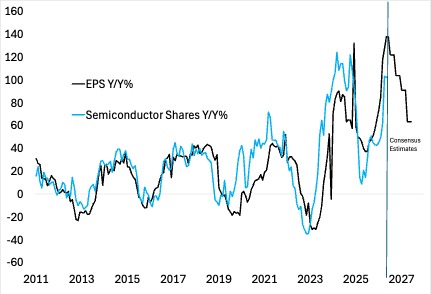
Not a single credible analyst has cut earnings estimates for key semiconductor producers (Figure 1). However, shares have already risen sharply and EPS for the cyclical industry has fallen every few years. This year’s expectation for the semi group is for EPS to more than double on the unsustainable boom in data center building. Yet even as EPS growth is expected to slow in 2027 and 2028, further earnings gains of 63% are expected in the next two years.
Given the semiconductor industry’s cyclicality, a drop in valuation is likely to coincide with further profit gains -- if they indeed occur. Our moderately bullish outlook for returns is still warranted, though increased volatility is a likely feature when profits are up and multiples are coming down.
None of the share price action represents a change in the supply/demand for the industry’s products. Investors should take some solace in the strong fundamental correlation between share price returns and earnings in semiconductors and other industry groups. This is present even as investors both buy and sell in panic from time to time.
Caution! The Most Promising Driver of Productivity is Growing at Unsustainable Pace
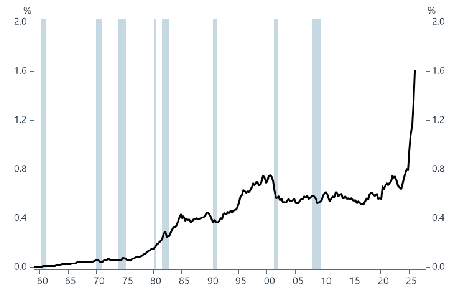
The boom in AI capital spending is the most promising but also least sustainable driver of the economy at present. As figure 2 shows, the boom in business investment in data centers has sent capex on computers – powered by market leading semis – to double the share of economic activity of just three years ago. Spending this year appears to be peaking at a 70% pace, a rate that would leave it larger than the whole US economy by the middle of the next decade if sustained, an impossibility.
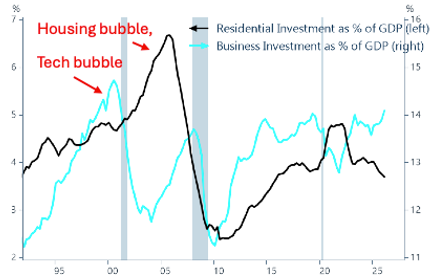
What is also striking to us is the relative modesty of the AI capex boom in a historical context and in economic breadth. The rise in data center spending is powering a rise in overall non-residential business investment. Yet the boom does not show up as a massively excessive rise in spending in the economy as a whole, such as seen in the housing bubble of the mid 2000s or the internet bubble of the 1990s (see figure 3).
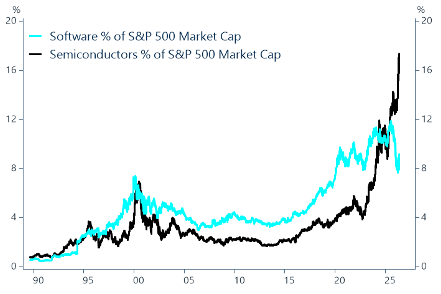
A shift from building the hardware capacity to deliver AI to integrating AI solutions into the economy lies ahead. This favors AI services and software over hardware. This is even as public-company market cap data provides an incomplete view of return potential and the risks (Figure 4). As an example, Anthropic and OpenAI (still private companies) will compete for a good share of this profit. End consumers may be the beneficiary.
Bear Markets and Real Recessions
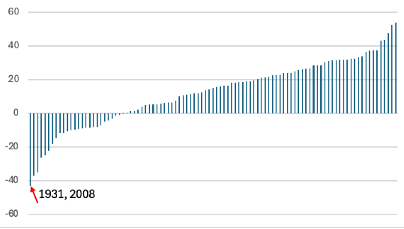
Investors in the S&P 500 have now realized a 15% annualized total return for the past decade, powered by the 26% annualized gain in the IT sector. We are reminded that the median annual S&P 500 return for the past century is also 15% (Figure 5). Unfortunately, gains have only occurred in 3 out of 4 years on average, with bear markets pulling down the compounded return to 10%.
Lasting bear markets[1] have generally all been driven by temporary retrenchments in corporate profits, most often coincident with economic recessions.
Periods of above-trend profit gains have lasted at times for most of a decade, before unwinding. We are now deep into a period of above-trend profits. Coupled with high valuations, this suggests the next decline in US share prices driven by a decline in corporate profits will be large, perhaps 30%, averaging in history’s largest and smallest cyclical declines. History tells us that such a drop in broad equity markets lies ahead in the medium-term.
[1] The brief crash of 1987 provides a contrary example.
While quite complex to measure and describe, data suggest that sustaining today’s valuations does not require extraordinary economic growth outside of key technology components such as semis. For one example, the median forward P/E of the 11 S&P 500 sectors is 18.2X excluding IT and Real Estate. This is not a figure that suggests unusually cheap valuations and high future returns by any means. What it does suggest, however, is a manageable degree of risk.
How corporate profits will be distributed between AI providers and users is an important variable for industry investors and stock pickers. What we don’t sense from the broad valuation data is that the economy and markets are at a highly vulnerable stage. In our view, however, it still argues for diversification to attractively valued, lowly correlated assets that haven’t run up in value and don’t require extraordinary growth to satisfy investor expectations (see figure 6).