Valuations Always Matter: A Prelude
How should investors consider the past when building their future portfolios? Substack, tiktok, Cramer, even software CFOs provide get-rich stock picks, while doomsters weave end-of-the-world conspiracies.
After 15 years of US equity returns averaging 15% per annum, complacency has been replaced by greed in the age of AI. Consider this: Over the past 5 years, Tesla has produced $32.6 billion in net profits. Its market capitalization is $1.4 trillion.
Over the past year, Micron Technology (MU) has added $830 billion in market capitalization. That’s a 635% gain in share price. Micron’s revenues are 79% DRAM and 21% flash memory. Hardly cutting edge. Here are Micron’s last 5 peak-to-trough stock prices declines since 2007:
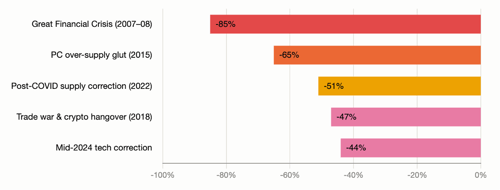
There’s no need to worry, however. 50 out of 53 Wall Street analysts rate Micron as a buy, 9 as an overweight. None recommend selling the stock.
At the moment, investors underestimate how much adverse change can come to their portfolios if they don’t invest with an understanding of today’s asset values and economic fundamentals.
Do valuations matter? You bet.
It's Boom Time
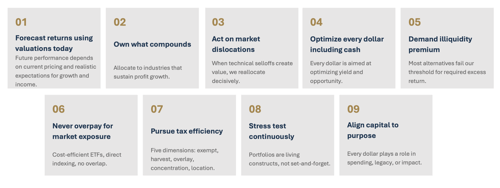
Our 2026 Mid-Year Review issued last week noted that it’s boom time. Corporate profits are soaring. Projected earnings suggest another quarter of nearly 30% growth in S&P 500 EPS lies ahead. We believe the earnings boom is likely to continue into the coming year (please see our Mid-Year Outlook.) With this in mind, we want to address the first of our core asset allocation principles (Figure 2).
We believe in “forecasting returns using today’s valuations.”
Never Say “Never Again”
Stocks, bonds, gold and other assets (some with much shorter histories, such as crypto), have seen their returns vary greatly, even when measured over long periods. Returns for each asset class depend on the economy’s performance, which is critical to analyze and forecast wisely. Returns also depend critically on valuation. And this requires complex, subjective measurement.
In the Great Depression, the US experienced the opposite of what investors are enjoying today – 15 years of slightly negative nominal returns for the broad US equity market ending in 1943.
More recently, the unwind of the late 1990s tech boom and onset of the housing-credit crisis also left US equities with a slight negative return for the ten years ending 2009.
We are hopeful that the prior macroeconomic policy mistakes which exacerbated the deepest slumps in US history are avoidable.
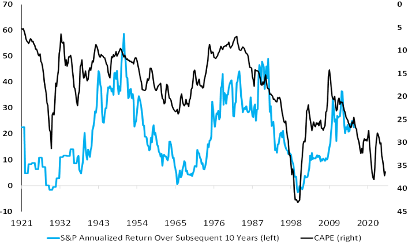
At the time that equity markets peaked in both prior periods, corporate profits were strong, growing to levels about 60% above their 10-year average. Valuations were at 20.2X in late 1929 and 28.0X in mid 2020 for the S&P composite respectively (see figure 3). Because earnings were so strong, valuation seemed high, but not wildly excessive. When earnings collapsed with valuation high, equity market losses were severe.
A Reckoning?
Equity market valuations have tended to rise over time. This suggests that today’s valuations are less stretched than a century of data might suggest. And we see no immediate bust for corporate profits.
So why dwell on these grim observations from the past?
We believe that high present valuations will reduce future broad US equity returns to 5% or less in the coming 10 years.
Here are two reasons. Most investment advisors remain confident that their very high current returns will rise effortlessly higher in the future. Many models in use by RIAs do the same.
Correct Math, Incomplete Equation
One can accurately say that US equity returns have been seven percentage points higher than inflation over the past century. (This is of course much lower than last year’s real return of 15.2%.) Therefore, if one invests 100% of their assets today in a passive equity strategy assuming a real return of 7% for a 25-year period, one should expect real wealth to expand potentially by 540%. Thus, setting aside even a small amount of money may generate a lifetime supply of wealth for your children in the future.
The problem with such estimates is simple. Like the past, US equity returns would have to significantly outstrip corporate profit growth in the future for this to be true.
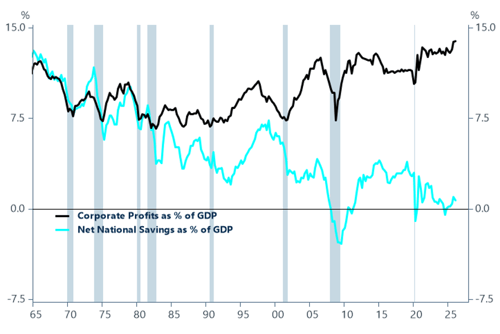
Valuations would have to continuously expand for today’s returns to stay on their present trajectory. Similarly, corporate profits would have to grow to an ever-larger share of national income. Both seem improbable.
Will Valuation Multiples Multiply Forever?
The market value of domestic corporations has risen to 250% of US GDP. (Figure 4) This compares to a Post World War II average just below 100%. Of course, US firms derive profits globally and have been gaining global share. Even considering global GDP growth, US equity values are rising faster.
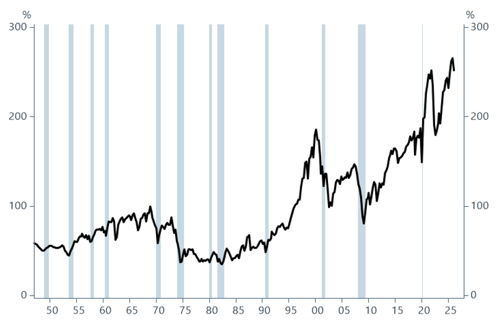
Profits, currently at a record high share of GDP, would need to repeat their leap higher for returns to continue at the historic pace (Figure 5). Otherwise, higher valuations would be necessary to drive long-term future returns.
Bond Markets Have a Valuable Lesson to Share
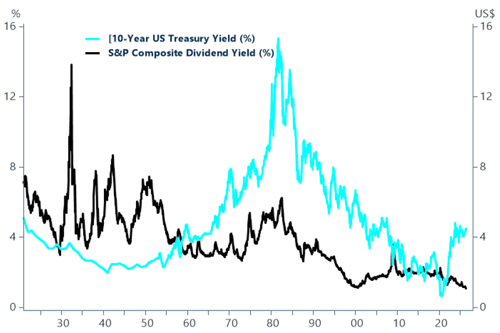
In 2020-2021, global bond market soared as yields reached history’s lowest level (Figure 6). At the time, we allocated to bonds near lowest possible strategic level. The consequent drop in fixed income returns in 2022 (-12.3% for US Treasuries), was history’s largest bond market loss. In that year, bond prices plunged and rates returned to norms not seen since prior to the Global Financial Crisis.
In the bond bubble period, it was critical not to assume that the historic average return of 4.5% for US Treasuries and 6.5% for corporate debt would be possible. Bonds had appreciated so drastically that yields were a fraction of their historic level.
This is the bond market’s lesson for tomorrow’s excessive equity valuation.
While we believe equity markets in the coming year will reflect corporate earnings gains, it is critical not to assume shares can only appreciate and profits only rise.
Demographics as Destiny
For a backward-looking audience, CIO Group’s risk management and diversified risk allocations may appear wasteful. Why not hope for the best?
Let’s start with a fundamental truth. Equity capital returns are derived from supplying the needs of the economy, which evolves and grows through time.
Today, artificial intelligence is accelerating an information technology and data security boom that will redefine what our economy is becoming. In the 1920s, the new industry was autos, which enjoyed returns roughly 2.5X that of broader equities. The automobile industry outperformed by displacing other forms of transportation.
What’s different now?
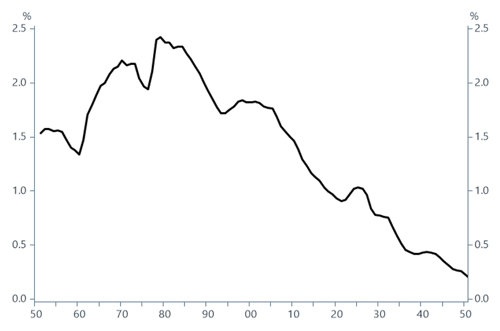
The world is an aging place, with slower working-age population growth to contribute to the economy. Without offset, this means slower overall output and income growth, including profits (Figure 7).
Perhaps artificial intelligence can change all that. AI can generate output, augmenting human labor. As its use and applications evolve, it may possibly reduce the cost of human labor, boosting corporate profits. But that is hardly a certainty.
The major impacts of AI on overall employment are yet to be felt. Most research suggests that since the widespread adoption of generative AI, early-career workers (ages 22-25) in the most AI-exposed occupations have experienced a relative decline in employment even after controlling for firm-level shocks.
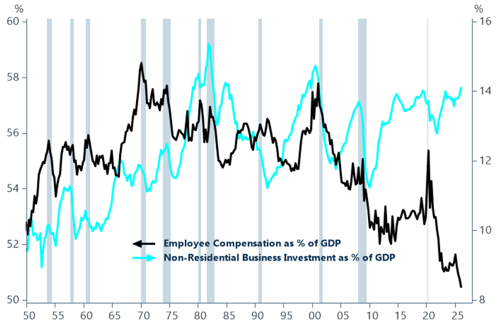
A broader and higher sustained level of unemployment triggered by the extraordinary efficiencies of AI could have recessionary impacts. Employee compensation as a percentage of GDP is clearly falling (Figure 8) and to the extent unemployment rate elevates, that trend may accelerate.
Too Much Capital, Too Little Return?
Similarly, an over-abundance of capital investment can “cheapen” the stock of capital, reducing its returns. Signs of this are present as competition to provide AI services seems more intense among large tech firms than seen in the past decade.
Hyperscalers are the dominant spenders. Amazon, Google, Meta, and Microsoft increased their combined data center capital expenditures by 76% in 2025, spending approximately $420 billion collectively. Goldman Sachs’ baseline model projects $765 billion in annual AI capex in 2026 rising to over $1 trillion by 2028.
As a percentage of GDP, the debt financed 1990’s telecom buildout was larger by comparison. Today, the hyperscalers who represent 80+% of all AI capex have free cash flow strength from legacy businesses that may insulate them from telecom-era busts.
However, there are concerning parallels to 1990s telecom companies among smaller cloud service providers, data center builders and in private credit more generally. These include customer concentration, vendor financing loops and equity cross-holdings by chip makers across major swathes of the AI ecosystem.
For Investors, It’s Best Not to Look In the Rear View Mirror
Valuation is a very poor timing tool in the absence of a forward-looking view of fundamentals. But it is of equal importance to fundamentals (such as corporate profits or credit worthiness) when projecting long-term returns.
As our Outlook and Mid-Year Outlook suggested, one needs a dynamic rather than fixed asset allocation to adapt to changing circumstances. Portfolios need “rudders” that can steer away from deflating assets. Most asset allocation models are blind to sector allocations and are unable to take advantage of superior returns or to swerve from outsized risks (see figure 9).
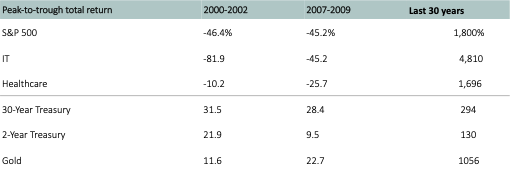
Our year-ahead outlook guides our tactical views even as we see US equities as very deep in a generous bull market. The “tech” sector in the US has generated very large share of US equity returns, 2.7X the S&P 500 in the past 30 years and we remain invested. Yet, even as we retain tech exposure, we are diversifying portfolios actively.
During the last unusually severe drop in the tech sector in 2000-2002, healthcare shares declined by just a fraction. Long-term US Treasury bonds jumped sharply in value and could do so again from present yield levels.
With available portfolio tools, it will not take wild timing bets in the options market to allocate more to these defensive assets when the current bull market “regime” ends.