War Over, Warsh Begins: Navigating New Realities
Dining in candlelight at the Palace of Versailles June 17th with Emmanuel Macron, President Trump signed an agreement to end the war with Iran. The conduct of the war brought new realities for major powers and for Iran itself. For the US, the “least worst” option was to extricate the country from an unwinnable war and to reopen the Strait of Hormuz before the US elections in November. For Iran, it was an opportunity to increase its regional influence, an outcome unthinkable just six months earlier. Whether both sides will adhere to the agreement or treat it as a “paper promise” is to be seen.
Markets Understood Outcomes First
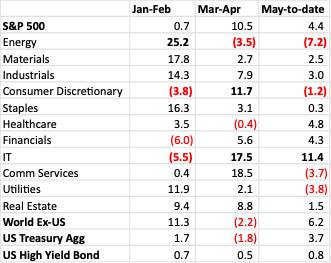
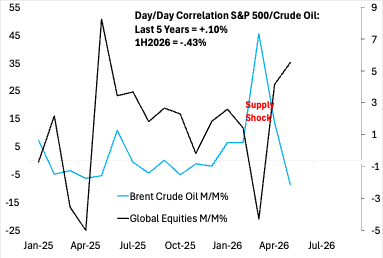
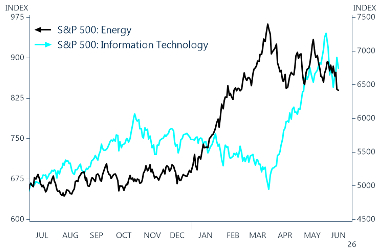
When the Iran War was “on”, surging oil prices and the possible re-opening of the Strait of Hormuz drove global asset prices up and down, day-to-day. Most commodities were swept along regardless of their own fundamentals (see Figures 1-2).
A record loss of crude oil from the Persian Gulf for more than three months did not catalyze a global economic contraction. But the “agreement to negotiate” has quickly led to a sharp, positive market reaction as the worst-case scenarios have been “priced out” of world asset markets.
Binary Outcome Thinking Hurts Returns
Looking back three months, if you believed energy and other key supplies traversing the Straits of Hormuz were absolutely critical to the world economy, you could imagine only bearish outcomes. Various pundits put a “clock” on their predictions, setting a date for when the shipping disruptions would devastate an industry or commercial activity.
If you believed the closure would be temporary, you might have ignored the whole conflict and invested with a bullish view given the resilience of the global economy. These investors would have suffered volatility, but captured the continued surge in AI-related tech.
Markets are always handicapping outcomes and usually anticipate them. By the time the first strikes took place, energy shares had already soared, while consumer and financial shares had cratered.
Minds Over Models
In March, CIO Group set out our initial views. We thought it best not to dramatically alter our equity/bond allocations because of the shock (please see episode 21). We added some energy-related income-generating assets in January and still hold them, and stayed modestly overweight global equities throughout 2026.
While the Iran conflict presented a drop in world energy supplies more severe than the 1974 OPEC oil embargo, circumstances in the world economy had shifted dramatically. Supplies of oil were plentiful and demand was being mitigated. The US is now the world’s largest energy producer and China has dramatically reduced its petroleum dependence (see episode 31).
Why did our clients navigate the Iran War well? We believed in two historic precedents:
-
Very rarely - less than 10% of cases we observe - do geopolitical shocks set the world economy into a new contraction (please see ep 21)
-
Maximum reactions – In crisis, it is common for traders to push up prices well beyond bounds that are supported by fundamentals. We call this the “crisis price.”
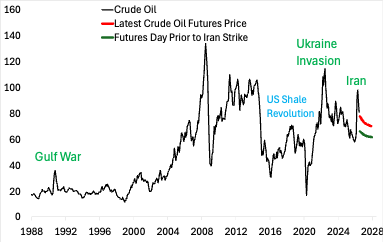
A “crisis price” situation was last observed in February/March 2022, when Russia’s invasion of Ukraine resulted in trade sanctions that re-directed Russian energy supplies (please see ep 27). In that period, global crude oil quickly spiked to $128 per barrel, but the peak was reached in just a month’s time in a conflict that still rages today (Figure 3).
Understanding the Odds: Lessons from Iran
Asset prices move very sharply on mere expectations. Energy shortages did not cause crude oil contracts to change hands in March at prices 40% above February.
Would a sustained $100 oil the price enough by itself to derail the world economy? We greatly doubted it. A continued blockade of the Straits of Hormuz was needed to sustain a $100 per barrel crude oil price for six months or more.
If an investor seeks to hedge worst-case outcomes, the resulting diminution in portfolio performance is sustained once the oil shock recedes. The assets that rose sharply from a higher oil price are weakened disproportionately, dragging down results (Figure 4).
A wise portfolio can’t seek the “highest” returns possible in a given moment of crisis. One must own both bullish and bearish assets to navigate shocks. In only three years during the past century have US equities and bonds fallen for the full calendar year at the same time, the last being 2022. While a blended portfolio will not perform as well as a “lucky bet” on either the worst- or best-case outcome, it can actually achieve better risk-adjusted returns.
At CIO Group, we systematically segregate risk tolerance of investors and manage portfolios accordingly. History suggests that asset allocations be tailored to seek the strongest return per unit of risk. Bonds are now priced to absorb risks far better today than in 2022.
Fed Chair Warsh Doesn’t Want to Be Your Friend
Speaking of 2022, new Fed Chair Warsh has set out to avoid the past mistakes of the pandemic era. He promised “price stability” without handholding from the US central bank.
Why did 2022 generate history’s largest bond market loss? Because investors had believed Fed guidance that interest rates would stay abnormally low far into the future – only for the Fed to realize its inflationary mistake.
Warsh said that investors should assess market risks, not rely on the Fed to tell them what future interest rate policy would be.
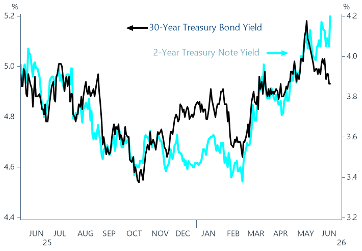
Ironically for the White House, investors who feared that the Fed would lose independence could be heard cheering after Warsh’s press conference. The US dollar soared. Long-term rates fell while short rates jumped 15 basis points (see figure 5).
Warsh Likely to Sustain Powell’s Rate Trajectory
The Fed’s updated economic forecast for 2026 is almost entirely driven by the war in Iran, with an expectation for 3.6% inflation this year followed by a drop to 2.3% in 2027. Roughly half of FOMC voters expected rates to fall in 2027 and half expected policy rates to rise.
Meanwhile, the roughly 30% drop in the crude oil price since the April high – and the tentative promise of resumed trade through the Persian Gulf - suggests a better balance of growth and inflation ahead.
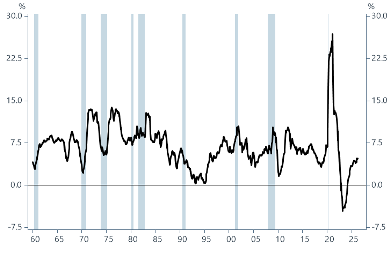
Long-term inflation hawks are seizing upon the Fed’s record of monetizing the massive demand stimulus of the pandemic and never getting inflation exactly back to 2% since (Figure 6). In contrast, the energy supply shock of recent months is not a monetary phenomenon. That will not stop some critics from citing recent inflation as a justification for rate hikes, even when the oil shock has passed.
As we noted in the last two weeks (ep 34 & 35) , the surprising signs of a reacceleration in the world economy even before the Iran trade deal and rebound in US labor demand should impact the policy trajectory. This strengthening in the economy, if it holds, would not justify immediate rate cuts even if inflation moderates.
Conversely, knocking the economy down to address an oil supply shock doesn’t make a great deal of sense. It’s possible that a small “tinkering” with policy rates lies ahead if the Fed wants to show impatience with the slow deceleration in inflation that was underway before the Iran conflict.
In the end, we believe Warsh may be stuck with former Fed Chair Powell’s recent assessment: “current US monetary policy is in a fairly good place.”